 Introduction
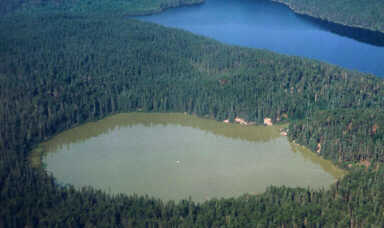
by Lindsay Husta, Audrey Smith, Christine Warzecha
Introductionby Lindsay Husta, Audrey Smith, Christine Warzecha
|
Description, Driving
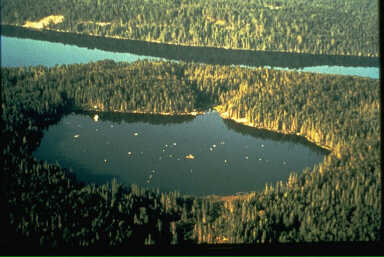
Question, Goals, Objectives, Rationale, Background, Standards: TEKS, NESA, Technology, Assessments Description Our project will concentrate on the determination of trophic
levels of water sources in Driving Question What causes lake eutrophication? (back to top) Goals 1. increased content knowledge in ecology, specifically nutrient and energy cycles and population dynamics 2. increased capacity for scientific thinking 3. increased oral and written communication skills 4. increased confidence in areas of content knowledge, scientific thinking and communication skills 5. increased interest or more positive attitudes towards science (back to top) Objectives Students will be able to:
Rationale Our precious lakes and rivers provide fresh water for drinking and daily use, and people of all ages value waterways for their beauty, for recreation and for their unique aquatic ecosystems. The nutrient content and species composition change naturally as a lake ages. However, human activities also impact the condition of our waterways. A recent international study by 1,360 scientists from 95 nations determined humans have “polluted or over-exploited two thirds of the ecological systems on which life depends, ranging from clean air to fresh water, in the past fifty years,” and it predicts devastating consequences in less than 100 years (Reuters, 5/30/05). Human impact on natural resources will move to the forefront of policy making within the students’ lives. Students must have a thorough understanding of the variables which affect water to make lifestyle and political decisions. In this six week project, students will test local waterways with a LCRA water expert, collect water quality data from other areas, and compare their research to similar projects. Scientists will also mentor students in design and implementation of experiments to determine potential human-driven effects on aquatic systems. Usually studied late in the year, if at all, ecology receives only superficial coverage even though it is a macroscopic topic which may seem more interesting and accessible to students. Studies show that students involved in project based learning take control over their own learning and acquire a better understanding of content and scientific processes (Barron, 1998). The final products, a written report and presentation will be shared with a wider audience, students in other classes and representatives from LCRA respectively, so students will practice vital communication skills beyond demonstrating competence to the teacher (Bruce and Rubin, 1993, Electronic Quills). (back to top) Background Eutrophication Eutrophication is a natural process. Nutrients from sediments are carried by runoff into surface waters such as lakes and bays and provide nourishment for algae in the aquatic ecosystem. However, human activities, including agriculture, domestic use of fertilizers, and modification of buffer zones near the water, increase the amount of nutrients reaching the water. The increased load of nutrients stimulates algae growth, decreasing the clarity of the water. As the algae decompose they take up oxygen, which affects the supply for fish and other aquatic life. From: enviroliteracy (also contains links to example studies and management issues, and models). Eutrophication passes through a continuum of nutrient levels, but the Carlson Trophic State Index consists of 3 simple tests. Phosphorus cycle Phosphorus is a vital nutrient used for molecules such as DNA and ATP. This biogeochemical cycle does not include a gas phase. Learn more about phosphorus at envrioliteracy. Inorganic phosphorus exists mainly as phosphate. Plants, algae, and phytoplankton uptake the phosphate and fix it into organic molecules. An diagram of the phosphorous cycle includes both terrestrial and aquatic phases. The phosphorus cycle normally occurs very slowly, but people are drastically altering the cycle through mining and fertilization. Learn more about human impacts and clean up efforts at the Natural History Museum site. Phosphorus rather than nitrogen is most often the limiting nutrient in aquatic systems as seen in this experiment in Canada. Decomposition in Aquatic Ecosystems Aquatic organisms influence (and are influenced by) the chemistry of the surrounding environment. For example, phytoplankton extract nutrients from the water and zooplankton feed on phytoplankton. Nutrients are redistributed from the upper water to the lake bottom as the dead plankton gradually sink to lower depths and decompose. The redistribution is partially offset by the active vertical migration of the plankton. Decomposers break down organic matter. They are sinks for
plant and animal wastes, but they also recycle nutrients for
photosynthesis.
The amount of dead material in a lake far exceeds the living material.
Detritus
is the organic fraction of the dead material, and can be in the form of
small
fragments of plants and animals or as dissolved organic material. In
recent
years, scientists have recognized that zooplankton grazing on detritus
and its
associated bacterial community represent an additional important
trophic
pathway in lakes. Adapted from Water on the Web. The Water Cycle There are many cycles in nature. A cycle is a process with no beginning or end. Cycles involve steps that move in a predictable pattern. At the end of the cycle, you find that you are back at the beginning. The water cycle is one example of a cycle in nature. The water cycle is of particular interest because it impacts our lives in many ways. Parts of the water cycle include the weather that we experience, the amount of water that we must add to our lawns in the summer time, the location of bodies of water for water storage and recreation, and the importance of water conservation. Here's another way to think about the importance of the water cycle. Approximately three-fourths of the Earth is covered with water--salt water. Of this water, approximately one percent is the fresh water on which we depend. The fresh water that we use and its continuous replacement is a result of the water cycle. When we think of the water cycle, we often first think of bodies of water on the surface of the Earth, such as lakes, reservoirs, oceans, rivers, and streams. Water from these surfaces enters the water cycle upon evaporation. Evaporation occurs when increases in energy (from the sun) is great enough to turn a liquid into a gas or water into water vapor. Water vapor is also added to the atmosphere by transpiration. Transpiration is the release of water by plants. Plants collect water through their roots and lose it as it evaporates into the atmosphere through small openings on the undersides of their leaves. Interestingly, only pure water evaporates. Only pure water turns into water vapor. In this way, we can get fresh water from salty ocean water. Once water vapor is in the air, it often stays there. This water vapor is called humidity. Humidity can vary from 0% in the deserts to 100% right before a summer rain storm. Warm air holds much more water than cold air. When water vapor cools, it condenses. We can see the condensation of water in the form of clouds. We can also see condensation whenever water vapor comes in contact with cold air or cooler objects. As water vapor cools into clouds, many things can happen to it, depending on the temperature. If the clouds stay relatively warm, the water vapor will collect into larger and larger drops until they are too heavy to stay aloft. Rain is one form of precipitation. Precipitation returns water from the atmosphere back to the surface of the Earth. If the clouds are cold enough, other forms of precipitation may occur. Water vapor may turn directly into snow in a process called sublimation (moving directly from a gas to a solid or a solid to a gas). Hail may be formed when rain drops are tossed high into the clouds and colder temperatures. As these small drops freeze, they are dropped lower into the clouds, coated with water, and then blown back up into the atmosphere to freeze again. When too heavy to be blown around in the clouds, hail stones drop to the Earth. When water returns to the Earth, it can be absorbed into the soil. This process is called percolation or infiltration. Water will trickle through the tiny spaces between the soil particles and eventually collect above an impermeable rock layer. This water and saturated soil above the rock layer is called ground water. Ground water can move to lower elevations and depression through underground "rivers." The top level of the ground water is called the water table. Any depressions in the Earth below the water table appear as lakes and ponds. Different types of soil will vary in their ability to absorb water. When water is not absorbed by the ground, it may create surface runoff. Runoff water travels over the surface of the ground and causes soil erosion. Evidence of this type of erosion can often be found in road cuts and other unprotected soil surfaces. Plant roots are important aids in the prevention of surface erosion. Precipitation that falls on the ground or on the surface of bodies of water can once again evaporate, starting the water cycle over again. The water cycle is an essential part of the natural system and is vital to all living things. Without the continuous return of fresh water to the land, land plants and animals could not exist. Excel Most people use Microsoft Excel, a popular spreadsheet program, to organize numbers and to create graphs. Spreadsheets also enjoy widespread use as a means to perform calculations. Spreadsheets perform calculations on a two-dimensional grid of cells. Customarily, the grid rows are labeled by numbers (1,2,3,...) and the columns by letter codes (A through Z, then AA through AZ, then BA through BZ, and so forth). In Excel, the grid is actually three-dimensional; each Excel file is a "book" consisting of two-dimensional "sheets" stacked on top of one another. Typically, we will try to do most of our calculations on a single sheet (usually called "Sheet1"). Each cell in the grid can contain nothing, a number, text, or a formula. To enter or change the contents of a cell, click on it. Formulas start with the "=" sign. Formulas specify that the contents of the cell are formed by a calculation that may involve other cells. Ranges of cells can be specified with a colon (":") -- for example, "B3:D5" denotes the 3-by-3 block of cells with B3 in the upper left corner, and D5 in the lower right. Excel also provides a variety of mathematical functions that operate on ranges, including sum (SUM), PRODUCT, aveage (AVERAGE), and STANDARD DEVIATION (STDEV). For example, the formula =SUM(A1:A12) denotes the sum of cells A1 through A12. The same syntax is used for all the functions: product, average, and standard deviation. Graphs to display data in an organized way is another important use of Excel. The process of making a graph from data takes four steps. First, select some data. Click and drag the mouse to select the numbers and words that you want to include in the graph. In some situations we will graph all of the data, but in many situations you won't want to include all the information in the graph. Next, you create a chart. From the menu bar choose Insert - Chart. Then choose the type of chart you want (column, bar, line, pie, and so forth). Then click the Finish button. After the graph is completed, examine your graph. Excel will construct your graph automatically but not always in exactly the way that you might wish. Make a note of what needs changing. Last, you will modify the graph. For simple graphs, you may not need to change anything. But if you do, simply double-click the item you want to change, and you will get a dialog box that lets you change it. To get rid of an item on the graph, you simply select it (one click) and press the delete or backspace key. To change a graph from one type to another, select the graph, and then from the menu bar choose Chart - Chart type... The best way to understand how this works is to make a graph of your own, and then try changing the type to see the results. Avoid the tendency to make the graph too fancy. Excel provides many formats, some of which are over-decorated and make your graph hard to understand. Choose the simpler formats and your graph will do better job communicating to its audience. (back to top) TEKS 1 Scientific processes. The student, for at least 40% of instructional time, conducts field and laboratory investigations using safe, environmentally appropriate, and ethical practices. (A) demonstrate safe practices during field and laboratory investigations (B) make wise choices in the use and conservation of resources and the disposal or recycling of materials. 2 Scientific processes. The student uses scientific methods during field and laboratory investigations. (A) plan and implement investigative procedures including asking questions, formulating testable hypotheses, and selecting equipment and technology; (B) collect data and make measurements with precision; (C) organize, analyze, evaluate, make inferences, and predict trends from data; and (D) communicate valid conclusions. (E) construct graphs, tables, maps, and charts using tools including computers to organize, examine, and evaluate data. 3 Scientific processes. The student uses critical thinking and scientific problem solving to make informed decisions. (A) analyze, review, and critique scientific explanations, including hypotheses and theories, as to their strengths and weaknesses using scientific evidence and information; (C) evaluate the impact of research on scientific thought, society, and the environment; (D) describe the connection between biology and future careers; 9 Science concepts. The student knows metabolic processes and energy transfers that occur in living organisms. (D) analyze the flow of matter and energy through different trophic levels and between organisms and the physical environment. 11 Science concepts. The student knows that organisms maintain homeostasis. (D) summarize the role of microorganisms in maintaining and disrupting equilibrium including diseases in plants and animals and decay in an ecosystem. 12 Science concepts. The student knows that interdependence and interactions occur within an ecosystem. The student is expected to: (A) analyze the flow of energy through various cycles including the carbon, oxygen, nitrogen, and water cycles; (B) interpret interactions among organisms exhibiting predation, parasitism, commensalism, and mutualism; (D) identify and illustrate that long-term survival of species is dependent on a resource base that may be limited; and (E) investigate and explain the interactions in an ecosystem including food chains, food webs, and food pyramids. (back to top) NESA Science Content Standards: 9-12 http://www.nap.edu/readingroom/books/nses/html/6a.html Fundamental abilities and concepts that underlie this standard include ABILITIES NECESSARY TO DO SCIENTIFIC INQUIRY IDENTIFY QUESTIONS AND CONCEPTS THAT GUIDE SCIENTIFIC INVESTIGATIONS. Students should formulate a testable hypothesis and demonstrate the logical connections between the scientific concepts guiding a hypothesis and the design of an experiment. They should demonstrate appropriate procedures, a knowledge base, and conceptual understanding of scientific investigations. DESIGN AND CONDUCT SCIENTIFIC INVESTIGATIONS. Designing and conducting a scientific investigation requires introduction to the major concepts in the area being investigated, proper equipment, safety precautions, assistance with methodological problems, recommendations for use of technologies, clarification of ideas that guide the inquiry, and scientific knowledge obtained from sources other than the actual investigation. The investigation may also require student clarification of the question, method, controls, and variables; student organization and display of data; student revision of methods and explanations; and a public presentation of the results with a critical response from peers. Regardless of the scientific investigation performed, students must use evidence, apply logic, and construct an argument for their proposed explanations. USE TECHNOLOGY AND MATHEMATICS TO IMPROVE INVESTIGATIONS AND COMMUNICATIONS. A variety of technologies, such as hand tools, measuring instruments, and calculators, should be an integral component of scientific investigations. The use of computers for the collection, analysis, and display of data is also a part of this standard. Mathematics plays an essential role in all aspects of an inquiry. For example, measurement is used for posing questions, formulas are used for developing explanations, and charts and graphs are used for communicating results. FORMULATE AND REVISE SCIENTIFIC EXPLANATIONS AND MODELS USING LOGIC AND EVIDENCE. Student inquiries should culminate in formulating an explanation or model. Models should be physical, conceptual, and mathematical. In the process of answering the questions, the students should engage in discussions and arguments that result in the revision of their explanations. These discussions should be based on scientific knowledge, the use of logic, and evidence from their investigation. COMMUNICATE AND DEFEND A SCIENTIFIC ARGUMENT. Students in school science programs should develop the abilities associated with accurate and effective communication. These include writing and following procedures, expressing concepts, reviewing information, summarizing data, using language appropriately, developing diagrams and charts, explaining statistical analysis, speaking clearly and logically, constructing a reasoned argument, and responding appropriately to critical comments. Life Science
THE INTERDEPENDENCE OF ORGANISMS · The atoms and molecules on the earth cycle among the living and nonliving components of the biosphere. · Energy flows through ecosystems in one direction, from photosynthetic organisms to herbivores to carnivores and decomposers. · Organisms both cooperate and compete in ecosystems. The interrelationships and interdependencies of these organisms may generate ecosystems that are stable for hundreds or thousands of years. · Living organisms have the capacity to produce populations of infinite size, but environments and resources are finite. This fundamental tension has profound effects on the interactions between organisms. · Human beings live within the world's ecosystems. Increasingly, humans modify ecosystems as a result of population growth, technology, and consumption. Human destruction of habitats through direct harvesting, pollution, atmospheric changes, and other factors is threatening current global stability, and if not addressed, ecosystems will be irreversibly affected. MATTER, ENERGY, AND ORGANIZATION IN LIVING SYSTEMS · All matter tends toward more disorganized states. Living systems require a continuous input of energy to maintain their chemical and physical organizations. With death, and the cessation of energy input, living systems rapidly disintegrate. [See Unifying Concepts and Processes] · The energy for life primarily derives from the sun. Plants capture energy by absorbing light and using it to form strong (covalent) chemical bonds between the atoms of carbon-containing (organic) molecules. These molecules can be used to assemble larger molecules with biological activity (including proteins, DNA, sugars, and fats). In addition, the energy stored in bonds between the atoms (chemical energy) can be used as sources of energy for life processes. · The chemical bonds of food molecules contain energy. Energy is released when the bonds of food molecules are broken and new compounds with lower energy bonds are formed. Cells usually store this energy temporarily in phosphate bonds of a small high-energy compound called ATP. · The complexity and organization of organisms accommodates the need for obtaining, transforming, transporting, releasing, and eliminating the matter and energy used to sustain the organism. · The distribution and abundance of organisms and populations in ecosystems are limited by the availability of matter and energy and the ability of the ecosystem to recycle materials. · As matter and energy flows through different levels of organization of living systems--cells, organs, organisms, communities--and between living systems and the physical environment, chemical elements are recombined in different ways. Each recombination results in storage and dissipation of energy into the environment as heat. Matter and energy are conserved in each change. THE BEHAVIOR OF ORGANISMS · Multicellular animals have nervous systems that generate behavior. Nervous systems are formed from specialized cells that conduct signals rapidly through the long cell extensions that make up nerves. The nerve cells communicate with each other by secreting specific excitatory and inhibitory molecules. In sense organs, specialized cells detect light, sound, and specific chemicals and enable animals to monitor what is going on in the world around them. · Organisms have behavioral responses to internal changes and to external stimuli. Responses to external stimuli can result from interactions with the organism's own species and others, as well as environmental changes; these responses either can be innate or learned. The broad patterns of behavior exhibited by animals have evolved to ensure reproductive success. Animals often live in unpredictable environments, and so their behavior must be flexible enough to deal with uncertainty and change. Plants also respond to stimuli. · Like other aspects of an organism's biology, behaviors have evolved through natural selection. Behaviors often have an adaptive logic when viewed in terms of evolutionary principles. (back to top)Technology National Technology Standards: Basic operations and concepts
Assessments Consisting of quizzes, safety and lab techniques, class participation, and a unit project, a student's grade will be determined using the rubric. Descriptions of each grade area follow. Quizzes Short quizzes to test comprehension of content area and experimental design. -Internet research and experimental design -Data Analysis -Nitrogen Cycle Unsafe lab practices will not be tolerated. Students must pass a safety quiz with
questions especially pertinent to the labs we will be doing before
starting on their experiments. Students
will get full points for Safety and Lab Techniques section unless they
break a rule in the Safety Contract. Each
infringement will result in a reduction of 5 points. After
4 infringements (or less at the teacher's discretion), a student may no
longer participate in labs and must go to the library to complete the
project using internet data or other sources. 0: unexcused absence 1: disruptive behavior/inattentive 2: mostly on task and at least 1 contribution 3: mostly on task behavior and multiple contributions The teacher will randomly choose 3 lessons, 3 lab days, and the field trip to assess the participation grades. The Group Work portion will be assigned by anonymous evaluation by the student's group members twice over the course of the project. Unit
Project Deadlines must be met and arrangements for
late work must be discussed with teacher ahead of the deadline. A bonus point towards the final paper grade
will be given for each assignment turned in on time. All
assignments can be revised.
|
||||||||||