| Introduction |
| Anchor Video |
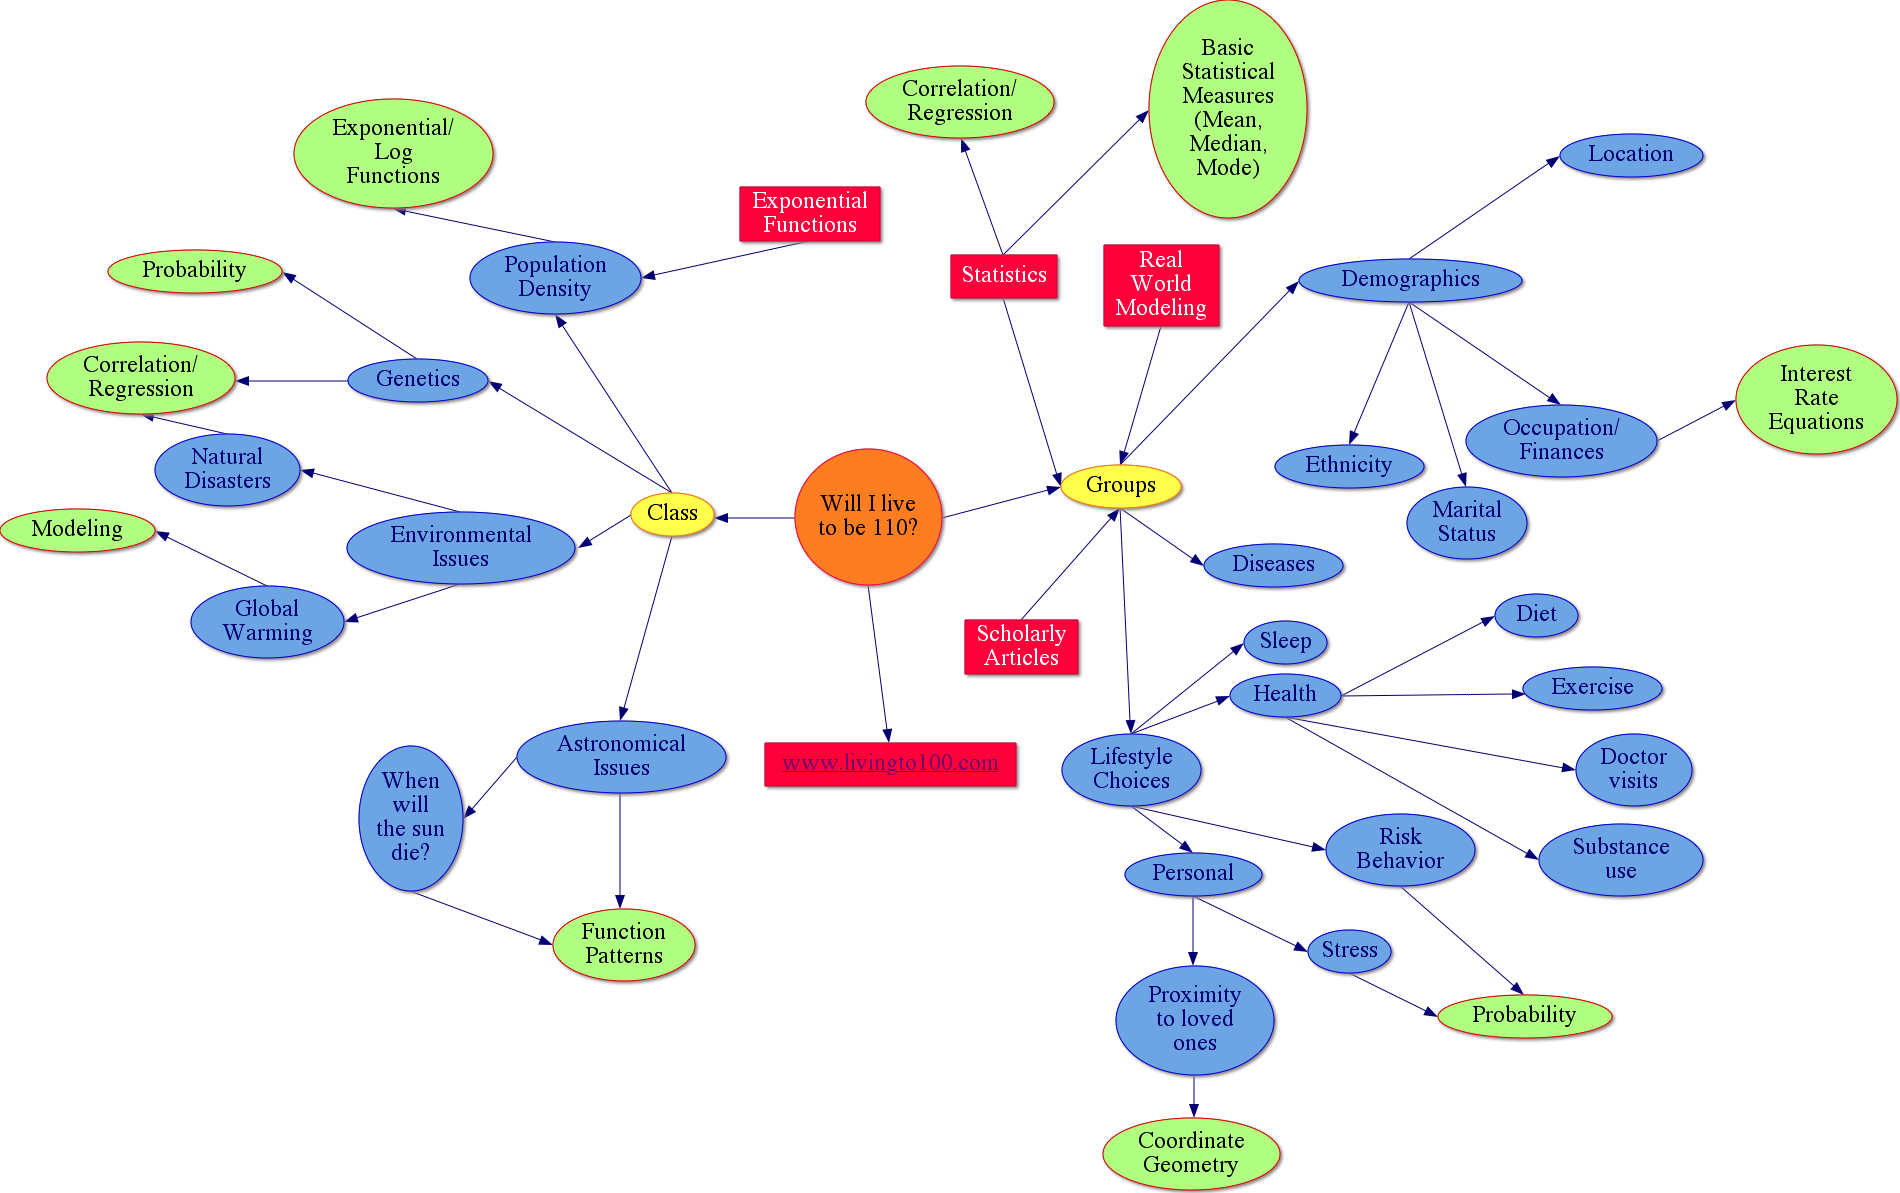
| Concept Map |
| Project Calendar |
| Lesson Plans |
| Letter to Parents |
| Assessments |
| Resources |
| Modifications |
| Grant |
This diagram created using Inspiration® 8.0 by Inspiration Software®, Inc.
Will I live to be 110?
I. Class
A. Astronomical
Issues
1. When
will the
sun die? Researching what the function is, what
all the
variables mean, and solving the function (Regression and function
patterns).
B. Environmental
Issues – Exponential/Log
Functions
(extinction rates, etc.)
1. Global
Warming – Discussing
when
and how models are useful, and what limitations they have.
2. Natural
Disasters – Looking at
what
affects your chances of being in a natural disaster with statistics
(i.e. if
you live in Kansas, youÕre much more likely to be in a tornado
than if you live
in Maine, or if you live on a river, youÕre more likely to be in
a flood).
C. Population
Density – Exponential
Model, population growth curves, predicting future values.
D. Genetics
– Using correlation
and
regression to discover how much your family history affect your
likelihood of
getting certain diseases and conditions. If
time, maybe the students could even conduct an
experiment of their own.
II. Groups
– For the group work,
we hope to come up with some
kind of general statistical guidelines. The
effects of most of the topics below (if not all) would
be
investigated using regression, function patterns, correlation, and
basic
statistical measure (mean, median, mode, standard deviation/variance).
A. Diseases
– Using Statistics to
calculate probabilities, looking at correlations to determine who gets
what
disease.
B. Lifestyle
Choices
1. Health
a. Exercise
– Calories burned as a
function of exercise, lifespan as a function of amount of exercise.
b. Substance
use
– Statistics on
alcohol,
drug, and other substance abuse as related to lifespan.
c. Diet
– functions with
multiple
variables (a=candy bars, b=fruit, c=serving of peanuts, d=sandwich,
etc.) where
we know average caloric content of each. Students
can make a function of their daily calorie intake
based on what
types (and how many of each,) different foods they eat.
d. Doctor
visits
- Looking at how
number
(frequency) of doctor visits relates to lifespan.
2. Risk
Behavior
– reckless/drunk
driving,
accidents during thrill seeking activities, etc. use
statistics to calculate probabilities, then use
functions to calculate an overall picture. (for
example, if 1/100,000 people die skydiving, and a
person plans to skydive 5 times in their life, their chance of dying
skydiving
would be 5(1/100,000), and that would be one piece of their larger
function of
if they will die prematurely. Add
a bunch of risky behaviors up like that.
3. Sleep
– If/Then Logic (If
I get enough
sleep, ThenÉ) Also, more regression and correlation studies on
how sleep
affects lifespan, and quality of life.
4. Personal
a. Stress-
Statistics again,
also maybe a little bit of
research on how to reduce stress levels. Students
should look at studies on reducing stress level
and explain
which methods for stress reduction work best based on the statistical
results
of the study.
b. Proximity
to
loved ones – coordinate
geometry – bringing algebra and geometry concepts together
(distance formula, how many relatives
live in a five mile radius, etc.)
C. Demographics-All of these subtopics are more of the
same, using
correlation, regression, and basic statistical measures to research how
these
things affect lifespan.
1. Marital
Status - See if married people or single people
live longer
using the same procedures outlined above.
2. Ethnicity
– There is an
abundance of
data on the internet that compares life expectancy of different race
groups in
different countries.
3. Occupation/Finances
– In addition to the
kinds
of studies outlined above, we could get into the interest rate
formulas, and
talk about how a small investment while in high school would become
tens of
thousands of dollars by retirement, and how to know what deal is best
when
buying a car.
4. Location
– Perhaps we could use
coordinate geometry for this as well. For example, maybe proximity to a
golf
course would be correlated with longer life span (not causally related)
because
typically golf courses are located in wealthy neighborhoods and wealthy
people
probably live slightly longer.