Lesson
Title: Extrapolating Data Using Ozone
Layer
Lesson developed by: Hina Siddiqui
Age group: Algebra I
Length of Lesson: 2 Class Periods
TEKS addressed
§111.32. Algebra I (One Credit).
(a) Basic understandings.
5) Tools for algebraic thinking. Techniques for working with functions and equations are essential in understanding underlying relationships. Students use a variety of representations (concrete, pictorial, numerical, symbolic, graphical, and verbal), tools, and technology (including, but not limited to, calculators with graphing capabilities, data collection devices, and computers) to model mathematical situations to solve meaningful problems.
(6) Underlying mathematical processes. Many processes underlie all content areas in mathematics. As they do mathematics, students continually use problem-solving, language and communication, and reasoning (justification and proof) to make connections within and outside mathematics. Students also use multiple representations, technology, applications and modeling, and numerical fluency in problem-solving contexts.
(b) Knowledge and skills.
(A.1) Foundations for functions. The student is expected to:
(A) describe independent and dependent quantities in functional relationships;
(B) gather and record data and use data sets to determine functional relationships between quantities;
(D) represent relationships among quantities using concrete models, tables, graphs, diagrams, verbal descriptions, equations, and inequalities; and
(E) interpret and make decisions, predictions, and critical judgments from functional relationships.
(A.2) Foundations for functions. The student is expected to:
(C) interpret situations in terms of given graphs or creates situations that fit given graphs; and
(D) collect and organize data, make and interpret scatterplots (including recognizing positive, negative, or no correlation for data approximating linear situations), and model, predict, and make decisions and critical judgments in problem situations.
(A.3) Foundations for functions. The student is expected to:
(A) use symbols to represent unknowns and variables; and
(B) look for patterns and represent generalizations algebraically.
Objectives:
· Students will be able to research and collect data using the Internet
· Students will be able to use Excel to enter in data, make graphs, and perform regressions
· Students will be able to interpret the patterns and trends they see in the graphs
· Students will be able to extrapolate data based on regressions
Overview:
Students will be engaged by the massive size of the hole in the ozone layer. They will research the increasing size of the hole from the early 1900s. Students will use Excel and its tools to analyze this data. They will then extrapolate it for the year 2107 to see if the trend continues, how big will the hole be and will it cover the entire Earth.
Resources:
- Computer Lab with Internet access
- Graph Paper
Five-E Organization
Engage:
|
Teacher does: Teacher
tells students that NASA scientists have said that the hole in the ozone
layer above It is an astonishing 10.6 million square miles, compared with 9.4 million square miles. Teacher
shows students a scaled model made out of Styrofoam of the Earth, the size of
Teacher poses the following question: “If the depletion of the Ozone Layer
continues at the current rate, how big will the hole be in 100 years from
now, in year 2107? Will it surround the entire Earth?” |
Student does: Students know that the North American continent is big, hence they are amazed that there can be a hole as large as this, even larger, in our atmosphere. Students
can visually see how big the Earth is (scaled down) and compare the size of Students begin to brainstorm the pieces of information they will need to answer the question. |
|
Questions: What
pieces of information do we need to answer the question? How
will we calculate the current rate of change of the hole in the Ozone Layer? |
Expected Student Response: The rate at which the hole is growing now. We can look at the data over the previous
years and find the pattern or rate of change in that manner. |
Explore:
|
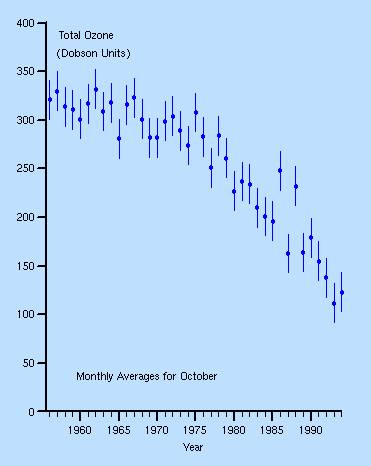
Teacher does: Teacher will ask students to research data beginning in the early 1900s. Teacher will have students collect and record the data into an Excel spreadsheet. The data they will collect will be the average yearly Ozone measured in Dobson units. |
Student Does: Students will use the Internet to search for when the depletion of the Ozone Layer begin and how big it has gotten over the years. Students will create a spreadsheet in Excel to collect and organize this data. |
|
Questions: When
was it first noticed that there was a depletion in the Ozone Layer? Has
the amount of Ozone remained the same, increased or decreased? Has
the rate of change increased or decreased? |
Expected Student answers: Around 1920. The amount has decreased (hence the hole
has gotten larger) The rate has increased, hence the hole is
growing at a quicker speed now. |
Explain:
|
Teacher does: Teacher will show students how to use Excel to make an xy scatterplot of the data they have collected. Teacher explains that even though we are measuring the amount of Ozone, in essence we are measuring the increasing size of the hole because the amount of Ozone is getting smaller. Teacher asks students to note any trends they see in the slopes of their graphs. |
Student does: Students create graphs of the average amount of Ozone per year. Students understand the relationship between measuring how little ozone there is in the atmosphere and the hole that is taking place of that ozone that has been depleted. Students will see that the ozone depletion was less in the beginning, early 1920s, but after around 1975 the amount of ozone beginning to get less and less at a much quicker rate. |
|
Questions: Do
your graphs exhibit positive or negative slopes? Are
the slopes increasing or decreasing in rate? What
does this mean? |
Expected Student Responses: Constant at the beginning, negative after
1975. The
rates are increasing.
|
Extend/Elaborate:
|
Teacher does: Teacher helps students fit a model to the data they have collected using regression tools in Excel. Once students have found a good fit for their data, they will need to use that model and extrapolate the data for the year 2107. |
Student does: Students go through the process of finding a best fit curve to their graph using regression tools in Excel (they will have learned some of this in the Excel tutorial from before) Students will use the regression analysis of their curve to calculate the amount of ozone that will be left in the year 2107. |
|
Questions: What
function would best model your graphs? Linear? Quadratic? Exponential
Something else? A combination? How
can we use this regression to find the amount of ozone in the year 2107? |
Expected
Student Response: Students might guess it is a combination
but not know what. They will have the opportunity to try the best fit with
Excel. We can take the regression model and
extend it to include the year 2107 and then read what the ozone level would
be at that time -OR We could take the equation Excel has given
us and put in the year 2107 as the x value and read what the y value will be. |
Evaluate:
|
Teacher does: After performing the regression analysis, students will be asked what percentage of the ozone layer will remain in the year 2107 and thus how large will the hole be? |
Student does: Students will confidently answer how much Ozone will be left in the year 2107. Students will need to calculate what percentage this is of the entire Ozone Layer and from that will be able to say how large the hole will be. |
|
Questions: How
can we use the amount of Ozone in 2107 to find how large the hole will be at
that time? Will
it cover the entire Earth? How
much of the Earth will it cover? Relate it back to the size of the
continents. |
Expected
Student Response: First we need to know how much the
atmosphere surrounding the Earth is in square miles or km. Then we can find
the percentage of the amount of Ozone in 2107 to that number. If we subtract
that from the total, we will have the size of the hole. Students answers may vary depending on
their analysis Students responses will vary. They
will need to research the size of the
other continents and find a suitable relationship to the size of the hole
they have calculated. |