Name: Sheila Ogden
Title of lesson: It Varies, Introduction to
Variables.
Length of lesson: 50 minutes
Source
of Lesson:
I. Description of the class:
Name of course: Algebra I
Grade level: 9th grade
Honors or regular: either
II. Performance or learner outcomes
Students will be able to
recognize the differences between independent and dependent Variables. Students
will also be able to graph from charts and data and label axes appropriately
with corresponding variables.
III. TEKS
1.A)The student understands that a function represents a dependence of one quantity on another and can be described in a variety of ways, The student describes independent and dependent quantities in functional relationships. B) The student gathers and records data, or uses data sets, to determine functional (systematic) relationships between quantities
IV.
Resources, materials and supplies needed
-stop watches
-Graph
Paper
V. Supplementary materials, handouts.
See attachments.
Teacher Does Probing Questions Student Does
|
Engage: Time __5 minutes
|
How long do you think you could jump up and down without rest? How fast do you think you could do this (how may times could you jump in a minute)? What conditions would effect the speed and duration of you jumping? |
Students throw out conjectures (expecting ridiculous ones, teacher throws them out). Weather, fitness level, etc. |
|
Explore: Teacher Breaks students up into groups of three or four. Students return to desks to make a table of their results Time 20minutes |
How did your jumping jack rate change as time passed? How is this shown in the table? What might this pattern suggest about how physical activity would change over a long period of time? |
Students designate a jumper, a counter, and a recorder.
The Jumper does jumping jacks while the timer watches the stop watch (or
clock) counting out loud at 5 second intervals. The recorder counts the
jumping jacks completed at the time intervals. |
|
Explain: Time 15 minutes
|
What are the two variables we wish to graph here? We need to chose which axis to put these measurements on. Usually we assign quantities to each axis by thinking about how they are related. Does one variable depend on the other? If so, that is the dependent variable and we put that on the x axis. The y- axis is for the independent variable. In this case the number of jumping jacks depends on time, so what are our variables? Students practice appropriate scaling and labeling of their graphs. Then the class compares graphs. |
Time and jumping jacks Jumping jacks (independent) Time (dependent) |
|
Extend / Elaborate: Time 5 minutes |
Given this table of Sheryl Swoop’s Statistics make a graph of her Average points per game throughout her WNBA career. .
What is the dependent variable, which is the independent variable? Why? |
Students recognize that the year is the dependent variable and the PPG is the independent variable. |
|
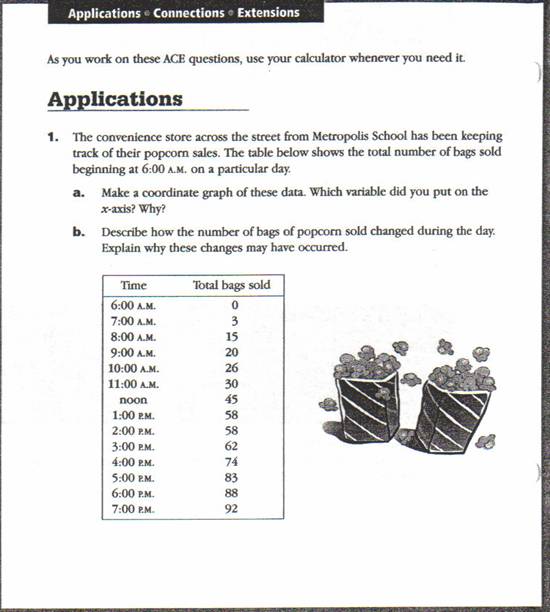
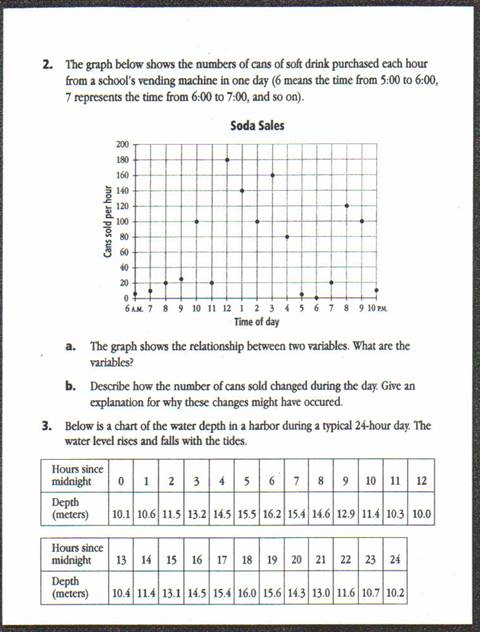
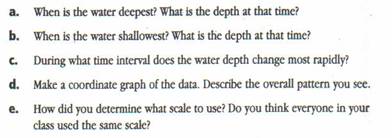
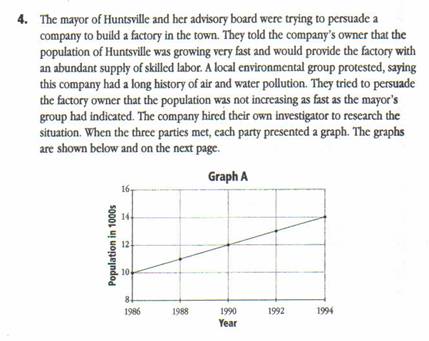
Evaluate: Applications worksheet as attached below for homework.
Approx. Time__.5_mins |
|
|