“Functions Made Easy”
Name: Brian Youn
Title of lesson: Functions Made Easy
Length of lesson: 50 minutes(?)
Description of the class:
Name of course: Algebra
Honors or regular: Either
Source of the lesson:
Adapted from “Functions Made Easy”, found at:
http://score.kings.k12.ca.us/lessons/functions.html
TEKS addressed:
(b) Foundations for functions: knowledge and skills and performance descriptions.
(1) The student understands that a function represents a dependence of one quantity on another and can be described in a variety of ways. Following are performance descriptions.
(A) The student describes independent and dependent quantities in functional relationships.
(B) The student gathers and records data, or uses data sets, to determine functional (systematic) relationships between quantities.
(C) The student describes functional relationships for given problem situations and writes equations or inequalities to answer questions arising from the situations.
(D) The student represents relationships among quantities using concrete models, tables, graphs, diagrams, verbal descriptions, equations, and inequalities.
(E) The student interprets and makes inferences from functional relationships.
I. Overview
Students
are introduced to the math concept of function as early as sixth grade. By the
end of the first year in algebra, the concept is more thoroughly formalized. A full
understanding will make advanced high school math and science less stressful
and more meaningful. It will even lend a richer meaning to the social sciences
and language arts for functions are basically about relationships and
connections.
II. Performance
or learner outcomes
Students will have a basic understanding of functions and will be able to identify parts of their project that can be modeled as algebraic functions. Students will explore the concept of functions as relationships, as machines, as equations, and as graphs. Students will also have the opportunity to work with a linear function on a graphing calculator.
III. Resources, materials and
supplies needed
At minimum students should have worksheets, graph paper, and pencil. This lesson can be enriched with a computer spreadsheet or graphing calculator.
IV. Supplementary materials, handouts.
The series of worksheets is attached.
Worksheet 1: Functions as Relationships
In the most simplest sense functions are relationships. The world is full of relationships. How good you are at a task- playing video games, dancing, or playing basketball- depends on how much time and effort you spend at doing it. How far you run depends on how fast you run and how long you run at that speed. Buying new shoes depends on your parents having money. Your parents having money depends on their having a job. Your parents having a job depends on how well they do their job and on how well the company is doing financially. Your grade in school is depends on how hard you work in school. How hard you work in school depends on your attitude toward school. An artist breaking up with her boyfriend might cause her to write a song or poem or draw a picture about how she feels.
Mathematicians and scientists seek to discover relationships in nature to understand how things work and make our lives better. Understanding the relationship between gasoline, air, and fire is what makes a car go. Understanding the relationship between heat and bacteria allows us to eat food safely. Understanding that electrons flow from a positive pole to a negative pole allows us to have c.d. players, telephones, and televisions.
On the worksheet below, write down at least ten relationships that exist in the real world. Look for connections. What effect has one on the other? How does one depend on the other? Example, getting rid of a headache depends on taking aspirin. In other words, getting rid of a headache is a function of taking aspirin. It could also be viewed in terms of cause and effect. Rain depends on low barometric pressure. In other words, rain is a function of low barometric pressure. When the barometric pressure drops (cause) it rains (effect).
|
Desired Result (Effect) |
Depends On (Cause) |
|
1. getting rid of headache |
1. aspirin |
|
2. rain |
2. low barometric pressure |
|
3. |
3. |
|
4. |
4. |
|
5. |
5. |
|
6. |
6. |
|
7. |
7. |
|
8. |
8. |
|
9. |
9. |
|
10. |
10. |
Now go to Worksheet 2, Functions as Machines.
Worksheet 2: Functions as Machines
Another way to understand a function is as a machine. A machine has an input and an output. There is a relationship that exist between the input and output. The output depends on the input. The machine receives the input and transforms it into the output. For example, a toaster is a machine. When bread is input in the machine the output is toast. A washer is a machine. When dirty clothes are input into the machine the output is clean clothes. An oven is a machine. When raw meat is input into the machine the output is cooked meat. Some machines are complex. The human body, for example, is the most complex and sophisticated machine known. Think of the myriad of physical, emotional, mental, social, and spiritual inputs needed to have healthy persons. The output is nothing less than the whole of civilization across time and geographical boundaries!
On the worksheet below list at least ten machines along with their inputs and outputs.
|
Input |
Machine |
Output |
|
1. bread |
1. toaster |
1. toast |
|
2. dirty clothes |
2. washer |
2. clean clothes |
|
3. |
3. |
3. |
|
4. |
4. |
4. |
|
5. |
5. |
5. |
|
6. |
6. |
6. |
|
7. |
7. |
7. |
|
8. |
8. |
8. |
|
9. |
9. |
9. |
|
10. |
10. |
10. |
Go to Worksheet 3, Functions as Equations.
Functions as Equations
Functions can also be expressed using math symbols. If x is the input and y is the output, then the value of y depends on the value of x. The relationship between x and y is determined by the machine, which is also known as the rule or equation. The machine changes or transforms x into y. Therefore, y is a function of x.
The table below illustrates the function y = x/2.
|
Input (x) |
Machine (Equation) |
Output (y) |
Relationship [ordered pair: (x,y)] |
|
6 |
6/2 |
3 |
(6,3) |
|
10 |
10/2 |
5 |
(10,5) |
|
14 |
14/2 |
7 |
(14,7) |
Notice that the machine transforms whatever the value of x is to y by cutting the value of x in half. What is the value of y when x is 50 or 100? The rule makes extending this pattern easy.
Machine Worksheet
Come up with two other functions expressed as equations. Select any 4 values for x and come up with the corresponding values for y.
|
Input (x) |
Machine (function) |
Output (y) |
|
x= |
|
y= |
|
x= |
|
y= |
|
x= |
|
y= |
|
x= |
|
y= |
|
Input (x) |
Machine (function) |
Output (y) |
|
x= |
|
y= |
|
x= |
|
y= |
|
x= |
|
y= |
|
x= |
|
y= |
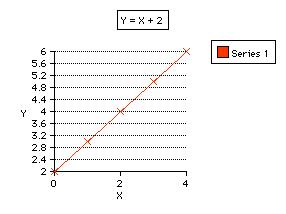
Functions as Graphs
Functions can also be studied graphically. The relationship (determined by the rule, equation, or machine) between the input (x) and the output (y) can be pictured as ordered pairs in the coordinate plane. Below is the graph of the first example from worksheet 3, y = x+2:
|
Input (x) |
Output (y) |
Ordered Pair (x,y) |
|
0 |
2 |
(0,2) |
|
1 |
3 |
(1,2) |
|
2 |
4 |
(2,4) |
|
3 |
5 |
(3,5) |
Do you notice a geometric pattern developing? Yes, the rule or machine produces points that lay on a line. These types of functions are also known as linear functions or equations. Go to Graphs worksheet for more practice.
Functions as Graphs Worksheet
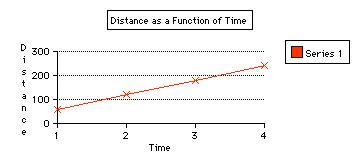
The graph above indicates that at 60 miles per hour the distance traveled depends on time. In other words, distance is a function of rate and time. At one hour a distance of 60 miles is covered. At 2 hours a distance of 120 miles is covered. According to the graph what distance is covered at 3 hours? 4 hours? Finish the table below.
|
Rate (miles per hour) |
Time (hours) |
Distance (miles) |
|
60 |
1 |
60 |
|
60 |
2 |
120 |
|
60 |
3 |
180 |
|
60 |
4 |
240 |
|
60 |
|
300 |
|
60 |
6 |
|
|
60 |
|
420 |
|
60 |
8 |
|
|
60 |
9 |
|
|
60 |
|
600 |
Graph the information above. Can you come up with the equation that expresses the relationship between rate, time, and distance?
Now go to finding the equation.
Finding the Function (Equation or Rule)
Through the scientific method, mathematicians and scientists collect data to discover rules that govern reality. Once discovered it gives us a better understanding of what's going on around us and it gives us an opportunity to make life better. One method of discovering these rules or functions is by using trial and error. If the graph of the data forms a line, another method for finding the linear equation is by finding the slope of the line, solving algebraically for the y-intercept, and putting the final equation in slope-intercept form. This method is presented well in textbooks and will not be presented again here. This presentation will show how a TI 82 can be used to find and graph the equation.
Go to the TI 82 worksheet. Use that data in the table below to find the equation.
|
Input (x) |
Output (y) |
|
1 |
7 |
|
2 |
11 |
|
3 |
15 |
|
4 |
19 |
|
5 |
23 |
You can further practice using the TI 82 to find and graph functions by the using the data on the previous pages.
TI-82 Regression
|
Note: = Key or Menu Selection. Æ = Use cursor key to choose menu. Before you begin: Clear the regular screen. Clear the Y= screen. To Enter Data: First Clear all List 2nd MEM 4: ClrAllLists - This clears all data stored in the lists. Then hit ENTER STAT 1: Edit - This will show you the empty
data columns. enter the independent variable in L1. Cursor over to L2 and enter the dependent variable. To see the Scatterplot: STAT PLOT - This is the 2nd Y= key. 1: Plot1 Select the following: On Type: first one Mark: square ZOOM 9:ZoomStat |
To calculate the equation that
best fits: STAT Æ CALC Choose from one of the following: 5: LinReg (ax + b) 6: QuadReg A: ExpReg Then hit ENTER a is the slope, b is the y-intercept. The closer
the r value is to + or -1, the better the fit of the curve. To see the equation that best
fits: Y= VARS 5: Statistics Æ Æ EQ Menu 7:RegEq GRAPH Now that you are done: STAT PLOT 4:PlotsOff ENTER Now you will see the screen with Done. |