Graphing Motion
Using Motion Detectors
Title of lesson: GRAPHING MOTION
USING MOTION DETECTORS
Author: Theresa
Hogan
(largely based from Jonas Trevino’s “Graphing with
Motion Detectors” lesson plan for his group’s project: “How Can You Represent
Motion?”- PBI Fall ‘04)
Length of lesson: 2 – 3
days
Grade level: Algebra I / Algebra
II
Source of the lesson:
http://uteach.utexas.edu/~gdickinson/pbi/PBIFall04/Motion/Content/motion.htm
Other sources:
http://education.ti.com/educationportal/activityexchange/activity_detail.do?cid=us&activityid=5559
(for in-class activity)
TEKS addressed:
A.1 (d) represent relationships among quantities using concrete models, tables, graphs, diagrams, verbal descriptions, equations, and inequalities
A.6 (a) develop the concept of slope as rate of change and determine slopes from graphs, tables, and algebraic representations
2A.1 (b) collect and organize data, make and interpret scatterplots, fit the graph of a function to the data, interpret the results, and proceed to model, predict, and make decisions and critical judgments
I. Overview
Students can use motion detectors to create
distance vs. time graphs. They can also develop a basic understanding of the relationship
between the x and y variables (distance vs. time) by participating in such
activities such as practice problems involving the graphs created.
II. Performance or learner outcomes
Students will be able to:
§
Assemble and disassemble the calculator, CBLs, and motion detectors
§
Analyze the graph coordinate system
§ Explain and apply the distance versus time relationship
III. Resources, materials and supplies needed
§
Calculators
§
CBLs
§
Motion Detectors
§
Connector Cables
IV. Supplementary materials,
handouts
§
Assembly diagram (can find on TI website)
§
Graphing worksheet activity (83tg_expl_Act02.pdf
on TI website, make changes/additions as desired to questions the worksheet
asks)
§ Quiz worksheet
Five-E Organization
Teacher
Does
Probing
Questions
Student
Does
|
Engage: Given
a graph, ask them to make up any hypothetical scenario that the graph could
represent. Ask students to identify what the x and y variables on the graph
represent. The goal of this engagement is to let students know the complete
freedom of what graphs can be used to represent, whether it is real life or
not. Teacher will encourage students to find unique relationships in their
graphs and representations. |
For
your scenario, what do the x and y variables represent? Why did you draw your
graph like you did? |
Student should create scenarios with given graphs and
explain to class how they came up with the scenario. They will also explain
what the x and y variables on the graph represent. |
|
Explore: Divide the class into appropriate size groups for
the number of motion detectors available. Give written instructions and
explain how to set up the calculator – CBR – motion detectors,
and allow time for set-up. Explain how the motion detectors work. Instruct
the students to experiment with the motion detectors and allow time for
experimentation.
|
We will ask a number of students for any observations
about the connection between motion and the resultant graph.
|
Students set up the calculator – CBR – motion
detectors. The students should experiment with the motion detectors. |
|
Explain: Ask students for hypotheses about what the x-axis
and y-axis represent for the graphs created by the motion detectors. Move on
when teacher is satisfied that students grasp the distance vs. time
relationship (x = time, y = distance).
|
Ask some or all questions (as needed) from the following list: 1. What physical
property is represented along the x-axis? 2. What are the
units? 3. What physical
property is represented along the y-axis? 4. What are the
units? 5. How far from
the CBR do you think you should stand to begin? 6. Should you walk
towards or away from the wall for a segment that slopes up? 7. Why? 8. Should you walk
towards or away from the wall for a segment that slopes down? 9. Why? 10. What should be
done for a flat segment? 11. For the given
graph, did you move towards or away from the graph? 11. How far did
you travel? (Questions suggested by Kate Brien) |
Students should answer questions appropriately. The
students’ responses to the questions should indicate whether or not they have
an understanding of the concepts. |
|
Extend
/ Elaborate: Teacher will ask students for ideas on what process(es) they would use to create certain segments on given graphs. Teacher
will draw a graph or two (as time allows) on the board and ask the students
to recreate the graph with their motion detectors. (Allow time to attempt the
graphing.) |
How
would you need to move to create an upward sloping section of the graph like
this? What about this section that looks like half of a bowl? |
Students explain how they would create certain segments on the graph. Students recreate graphs using the motion detector and give a brief explanation on how they created each graph. |
|
Evaluate: To
see what the students’ understanding of the connection between their actions
with the motion detectors and the time versus distance graphs they create, an
evaluative quiz/worksheet (“QUIZ”) will
be administered. It will ask summative questions such as what the x-axis and
y-axis represent, and it will have graphs for which they must explain how a
motion detector could be used to recreate them.
|
|
The quiz will hopefully be a positive indicator of
their understanding of the motion detectors and graphs. |
QUIZ
1. Could you walk to produce a horizontal line?
Give reasons for your answer.
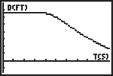
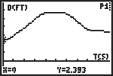
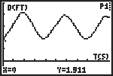
2. For each of the graphs below, describe the motion of the walker.
A B C D
|
|
|
|
|
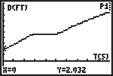
A:
B:
C:
D: